Hi, in this tutorial I am going to tell you how to install and access Kubernetes Dashboard. This post is based on the YouTube video:
Kubernetes Dashboard is a web-based user interface to manage cluster resources.
Installing the dashboard
Let’s start by installing the dashboard.
Before doing it you need to install Helm, kubectl and, of course, have access to the Kubernetes cluster.
Add a repository:
helm repo add kubernetes-dashboard https://kubernetes.github.io/dashboard/
Update the information about available charts.
helm repo update
Check the last versions of the application.
helm search repo -l kubernetes-dashboard/kubernetes-dashboard | head -3
NAME                                            CHART VERSION   APP VERSION     DESCRIPTION
kubernetes-dashboard/kubernetes-dashboard       7.5.0                           General-purpose web UI for Kubernetes clusters
kubernetes-dashboard/kubernetes-dashboard       7.4.0                           General-purpose web UI for Kubernetes clusters
In my case, the last version is 7.5.0.
Download helm values to investigate them.
helm show values kubernetes-dashboard/kubernetes-dashboard --version 7.5.0 > values.yaml
I will override only values to deploy additional resource ingress. These values are stored in the file my-values.yaml.
app:
  ingress:
    enabled: true
    hosts:
      - dashboard.demo.com
    ingressClassName: nginx
After deploying an ingress object I’ll be able to access the dashboard using the domain: dashboard.demo.com.
If you don’t have installed Ingress Controller you can access the dashboard using the kubectl port-forward command. I’ll show you how to do it. Afterward, check my video on how to install the Ingress Nginx Controller.
We are ready to start the installation.
helm upgrade --install \
             --namespace dashboard \
             --create-namespace \
             --debug \
             --values my-values.yaml \
             --version 7.5.0 \
             kubernetes-dashboard kubernetes-dashboard/kubernetes-dashboard
In my command, I added the debug option to output additional information on the screen during installation and override some values with file my-values.yaml.
The installation is completed.
Check the installation
Let’s check that the pods are running.
kubectl -n dashboard get pod
You will see something like this:
$ kubectl -n dashboard get pod
NAME                                                    READY   STATUS    RESTARTS       AGE
kubernetes-dashboard-api-54b8db468c-zbzdr               1/1     Running   1 (7h5m ago)   2d2h
kubernetes-dashboard-auth-6c7cb89b9c-fwttr              1/1     Running   1 (7h5m ago)   2d2h
kubernetes-dashboard-kong-7696bb8c88-8hq5x              1/1     Running   1 (7h5m ago)   2d2h
kubernetes-dashboard-metrics-scraper-5485b64c47-dbp9c   1/1     Running   1 (7h5m ago)   2d2h
kubernetes-dashboard-web-596b7c6f99-ppjqj               1/1     Running   1 (7h5m ago)   2d2h
Before opening the dashboard I need to add my domain dashboard.demo.com to the /etc/hosts file to resolve it.
kubectl -n dashboard get ingress

echo 192.168.1.10 dashboard.demo.com | sudo tee --append /etc/hosts

grep dashboard.demo.com /etc/hosts
The output:
192.168.1.10 dashboard.demo.com
192.168.1.10 is the IP address of the HAProxy that balances traffic to the instances of the ingress nginx controller.
It’s done. Let’s open the dashboard.
Access the dashboard
In the previous versions of the dashboard, you could connect to it via bearer token or kubeconfig. Now you have only one option. It is a bearer token.
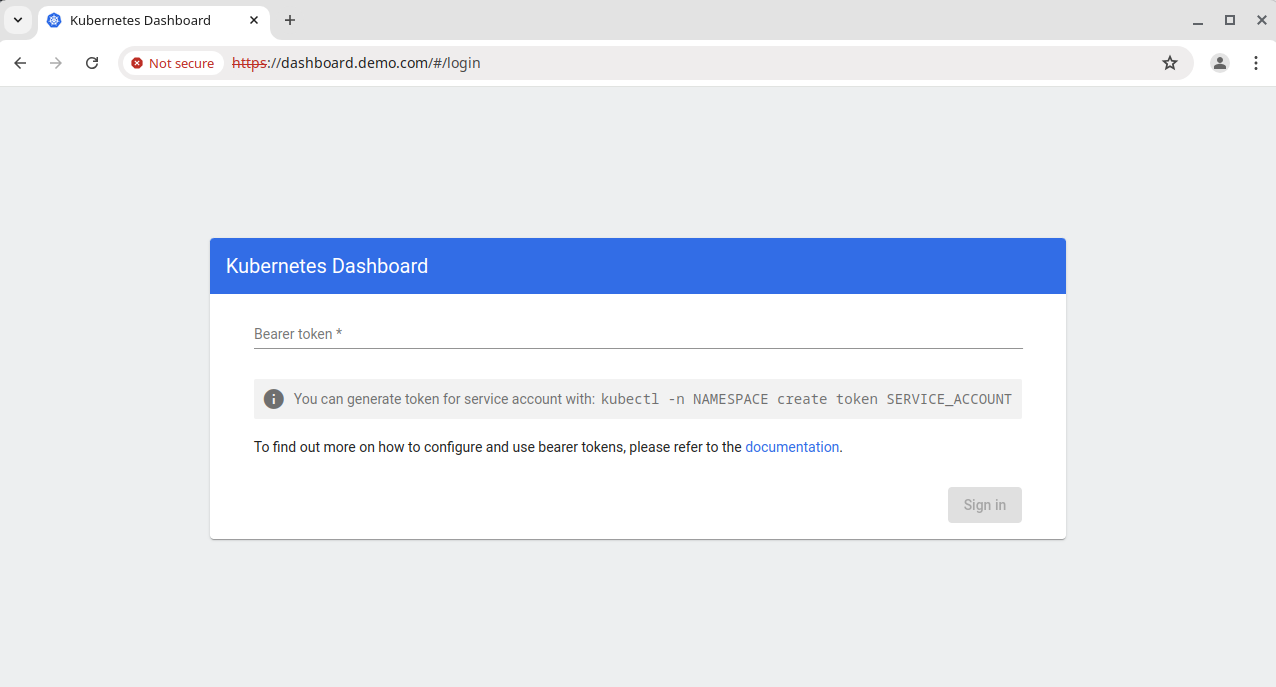
As I mentioned before if you don’t have an ingress controller, you can use the kubectl port-forward command. Let’s execute it.
First, find out the name of the service which responsible for processing the requests from the browser.
kubectl -n dashboard get svc
The output:
NAME                                   TYPE        CLUSTER-IP        EXTERNAL-IP   PORT(S)                         AGE
kubernetes-dashboard-api               ClusterIP   100.128.124.50    <none>        8000/TCP                        2d2h
kubernetes-dashboard-auth              ClusterIP   100.128.124.115   <none>        8000/TCP                        2d2h
kubernetes-dashboard-kong-manager      NodePort    100.128.34.93     <none>        8002:32700/TCP,8445:30412/TCP   2d2h
kubernetes-dashboard-kong-proxy        ClusterIP   100.128.147.78    <none>        443/TCP                         2d2h
kubernetes-dashboard-metrics-scraper   ClusterIP   100.128.51.93     <none>        8000/TCP                        2d2h
kubernetes-dashboard-web               ClusterIP   100.128.27.216    <none>        8000/TCP                        2d2h
It is the kubernetes-dashboard-kong-proxy service.
Second, execute the main command.
kubectl -n dashboard port-forward service/kubernetes-dashboard-kong-proxy 8000:443
Third, open the browser https://localhost:8000.
You will see something like this in the console:
Forwarding from 127.0.0.1:8000 -> 8443
Handling connection for 8000
Handling connection for 8000
It works fine.
Creating the service account
Let’s create a service account, Cluster Role Binding, and Secret Token used to access the dashboard web user interface. I’ve prepared the manifest before.
apiVersion: v1
kind: ServiceAccount
metadata:
  name: my-user
  namespace: dashboard
---
apiVersion: rbac.authorization.k8s.io/v1
kind: ClusterRoleBinding
metadata:
  name: kubernetes-dashboard-binding
roleRef:
  apiGroup: rbac.authorization.k8s.io
  kind: ClusterRole
  name: cluster-admin
subjects:
- kind: ServiceAccount
  name: my-user
  namespace: dashboard
---
apiVersion: v1
kind: Secret
type: kubernetes.io/service-account-token
metadata:
  name: my-user-token
  namespace: dashboard
  annotations:
    kubernetes.io/service-account.name: "my-user"
You can see a ServiceAccount named “my-user”, ClusterRoleBinding binds a predefined Cluster Role cluster-admin to our service account and token for the service account.
Deploy the manifest.
kubectl apply -f token.yaml
Then extract the token from the secret.
kubectl -n dashboard get secret my-user-token -o yaml | grep token:
The token:
token: <TOKEN>
As you know all secrets are stored in base64 format so decode it.
echo <TOKEN> | base64 -d
Copy the decoded token and paste it into the input field on the authentication page.
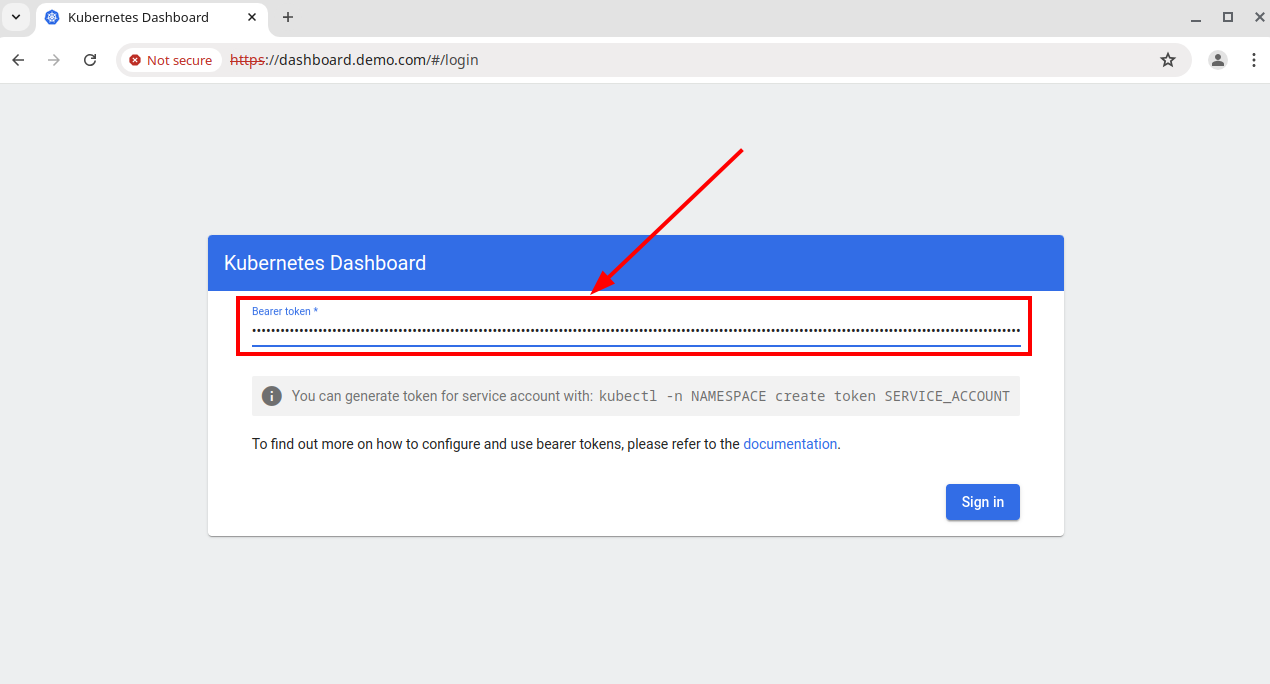
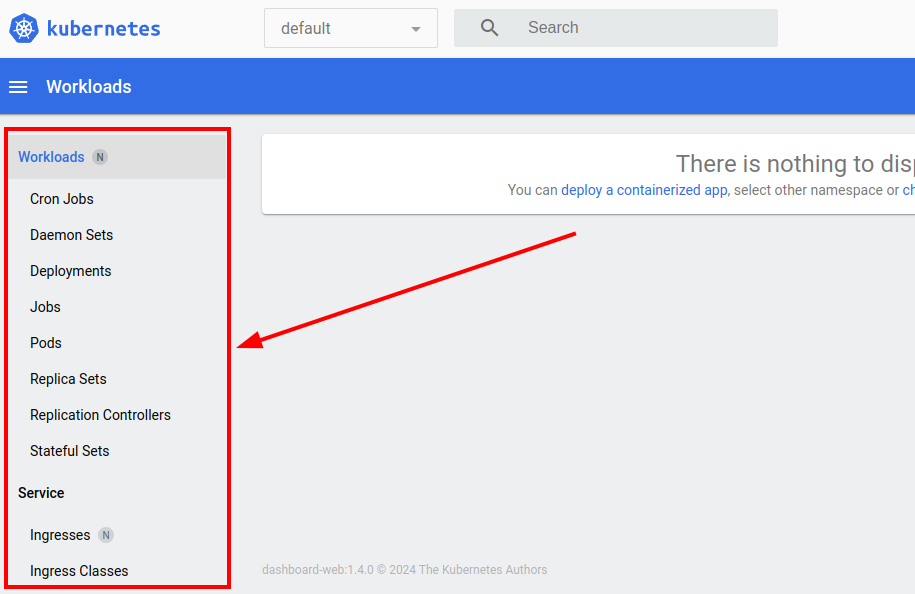
We are in.
In the dashboard web interface, there are different Kubernetes objects—for example, pods, deployments, and so forth.
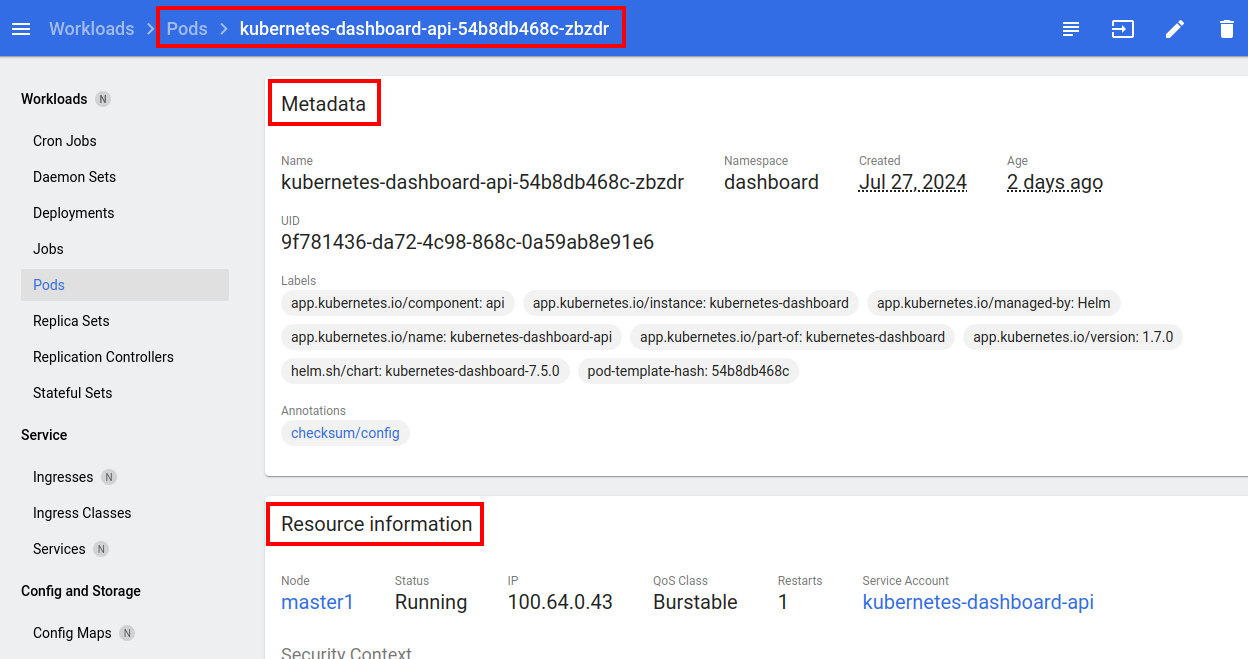
You can also see information about these objects:
- metadata
- conditions
- and so on
This dashboard is a good choice for people who don’t work with Kubernetes as administrators. For example, software engineers.
You can explore logs of the pods and execute commands within pods using Kubernetes Dashboard.
Also, you can create manifests. For example, let’s create a read-only service account.
apiVersion: rbac.authorization.k8s.io/v1
kind: ClusterRole
metadata:
  name: ro-cluster-role
rules:
- apiGroups: ["*"]
  resources: ["*"]
  verbs: ["get", "list", "watch"]
---
apiVersion: v1
kind: ServiceAccount
metadata:
  name: ro-user
  namespace: default
---
apiVersion: rbac.authorization.k8s.io/v1
kind: ClusterRoleBinding
metadata:
  name: ro-clusterrolebinding
roleRef:
  apiGroup: rbac.authorization.k8s.io
  kind: ClusterRole
  name: ro-cluster-role
subjects:
- kind: ServiceAccount
  name: ro-user
  namespace: default
---
apiVersion: v1
kind: Secret
type: kubernetes.io/service-account-token
metadata:
  name: ro-user-token
  namespace: default
  annotations:
    kubernetes.io/service-account.name: "ro-user"
As you see the read-only user can get, list, and watch resources in all apiGroups. Upload the manifest.
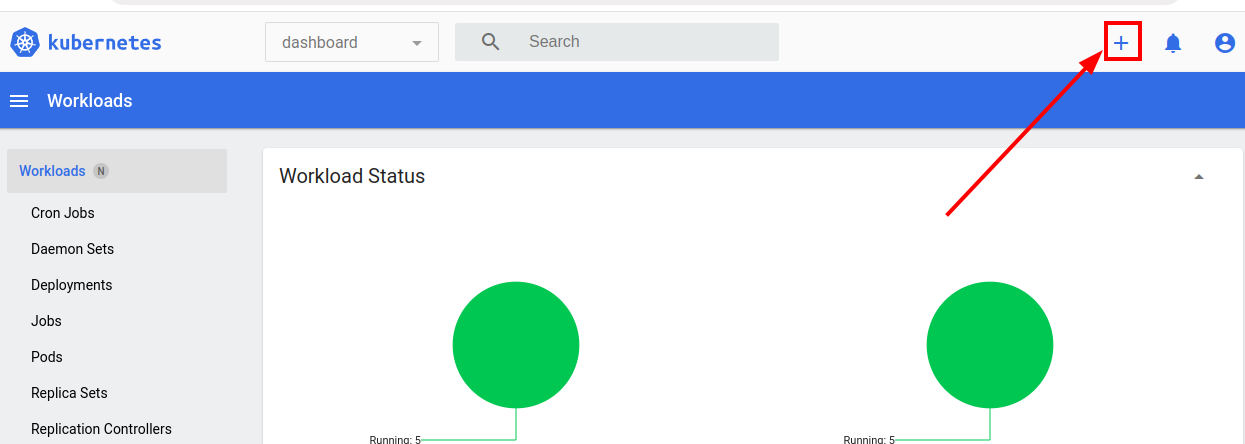
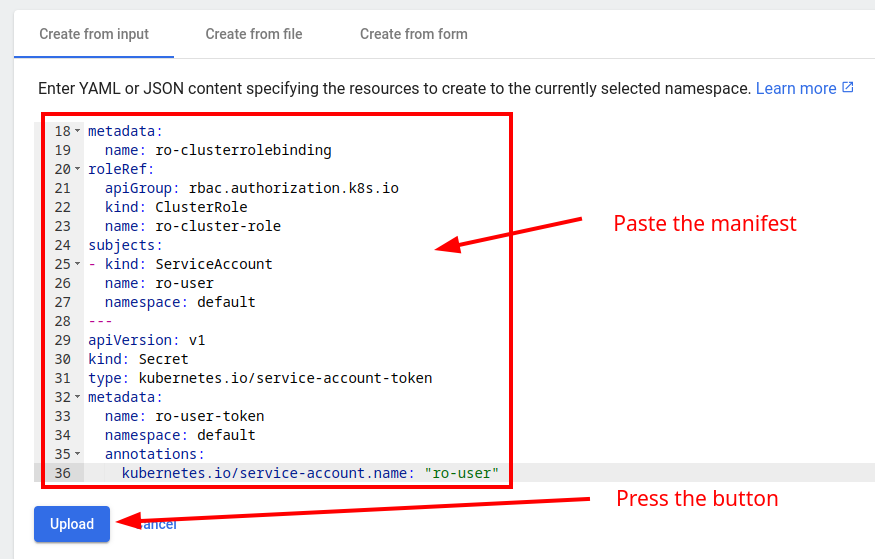
Let’s take the token. Go to the page https://dashboard.demo.com/#/secret?namespace=default and
open the secret.
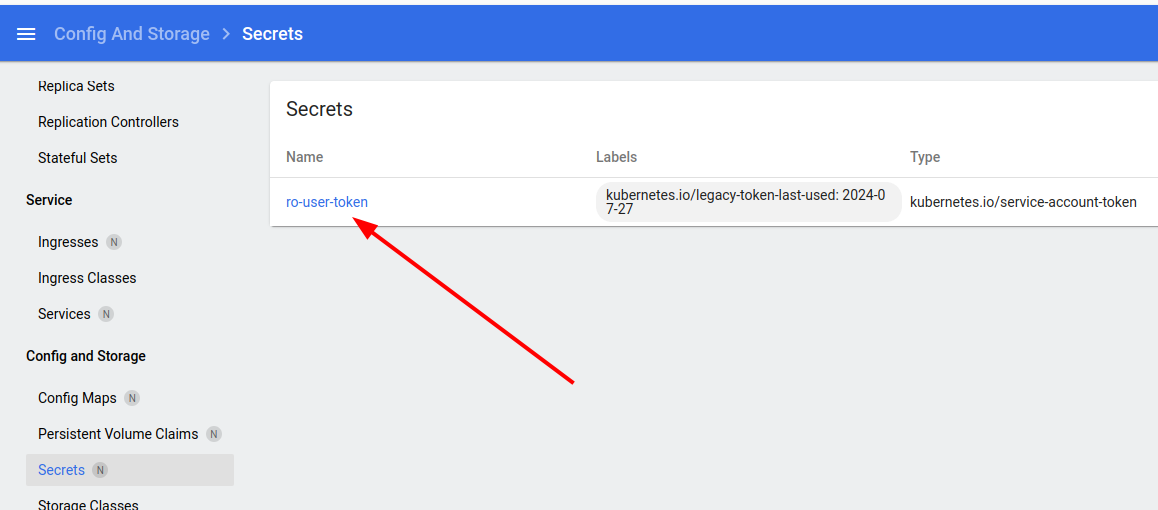
It is in decoded format. Copy it.
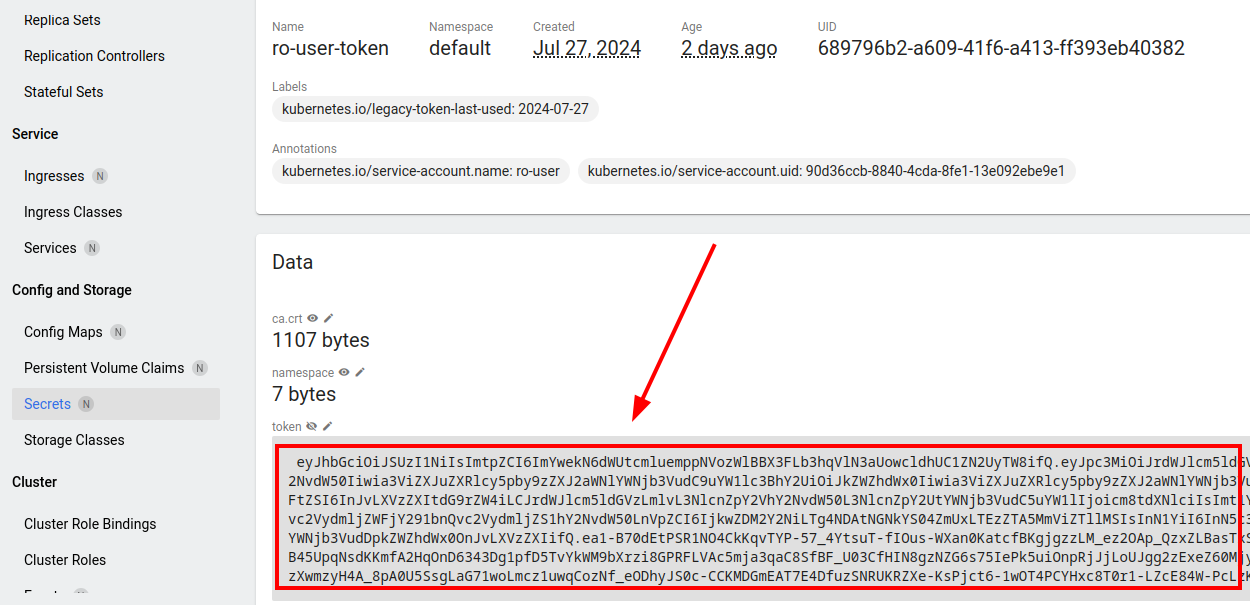
Exit the dashboard.
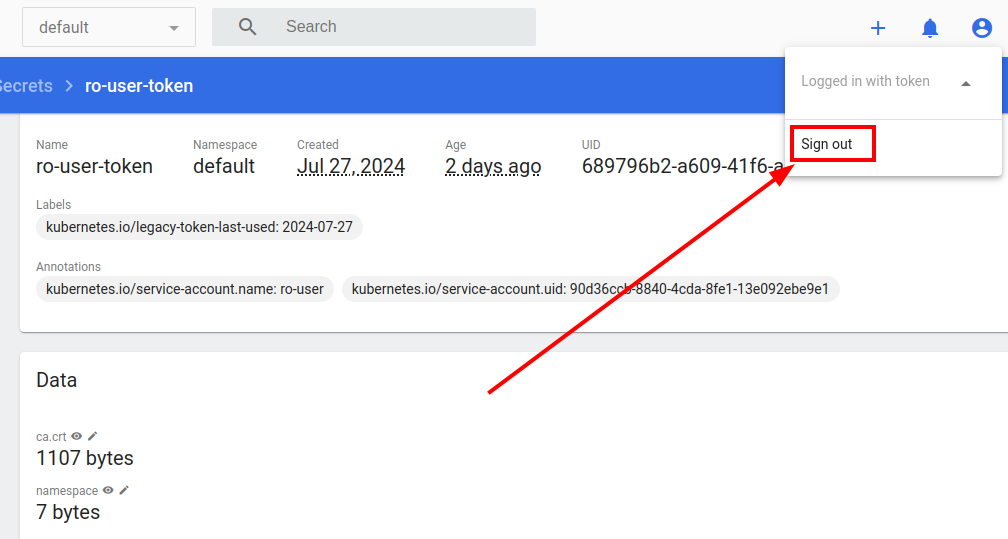
Paste your token in the bearer token field and sign in.
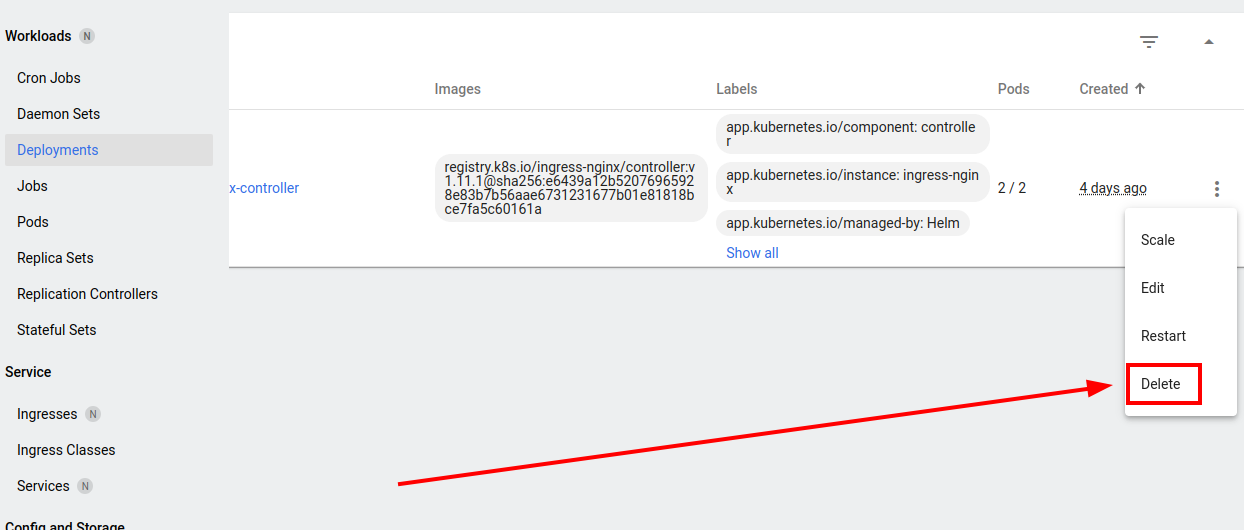
Try to delete something. For example, kubernetes-dashboard-web deployment.
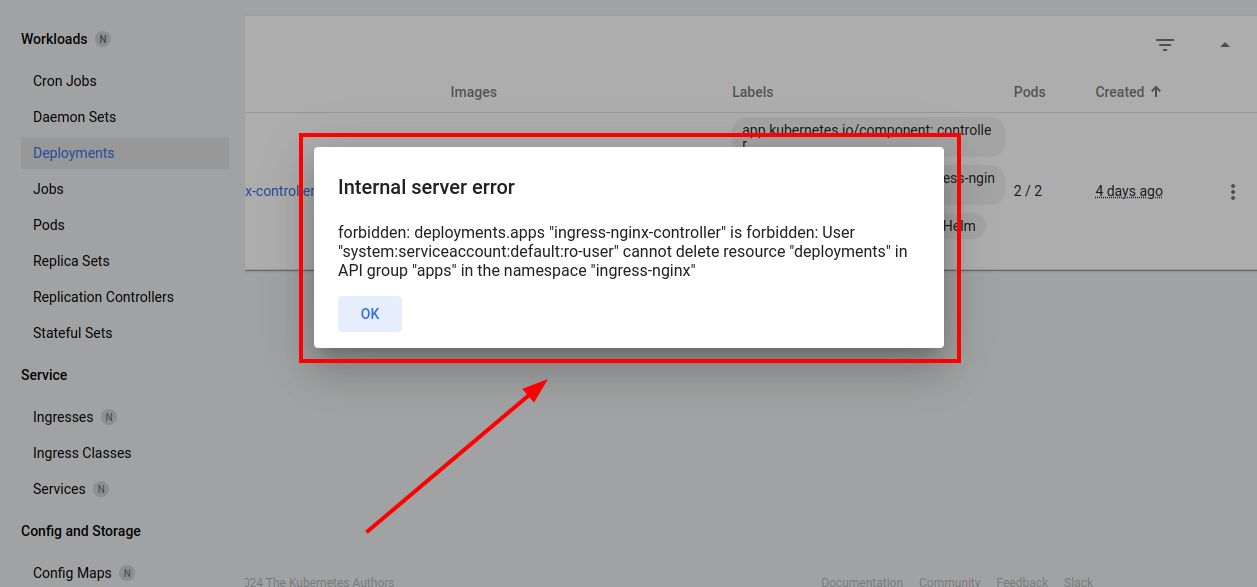 Try to create a new deployment. The manifest:
apiVersion: apps/v1
kind: Deployment
metadata:
  name: nginx-deployment
spec:
  replicas: 1
  selector:
    matchLabels:
      app: nginx
  template:
    metadata:
      labels:
        app: nginx
    spec:
      containers:
      - name: nginx
        image: nginx:latest
        ports:
        - containerPort: 80
Of course, you can’t create resources too.
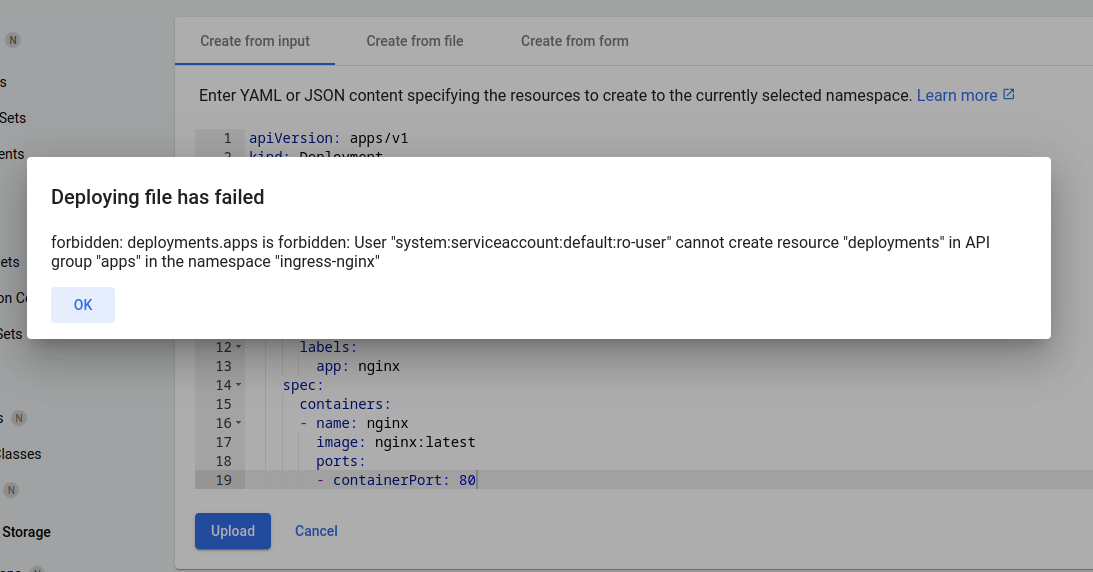 It is forbidden because this user has read-only permissions.
That’s it. I hope this information was helpful to you.