Hi, in this post I am going to tell you how to install Prometheus, Alert Manager, and Grafana on the Kubernetes cluster using the kube prometheus stack helm chart. This post is based on the YouTube video:
Besides those components, you will receive predefined Grafana dashboards, Prometheus Operator, and much more. You can find all components in the official documentation.
Prerequisites
To complete the installation, you need to fulfill the following requirements:
- install helm
- prepare access to your Kubernetes cluster
- install Ingress Nginx Controller. You can find out how to do it in one of my videos.
Installation
Let’s get started.
First, add a chart repository and update the information about available charts.
helm repo add prometheus-community https://prometheus-community.github.io/helm-charts
helm repo list
helm repo update
Then find out the last version of the chart.
helm search repo -l prometheus-community/kube-prometheus-stack | head -3
NAME                                            CHART VERSION   APP VERSION     DESCRIPTION
prometheus-community/kube-prometheus-stack      61.3.2          v0.75.1         kube-prometheus-stack collects Kubernetes manif...
prometheus-community/kube-prometheus-stack      61.3.1          v0.75.1         kube-prometheus-stack collects Kubernetes manif...
The last version is 61.3.2.
The next step is to download default values using the command “helm show values”.
helm show values prometheus-community/kube-prometheus-stack --version 61.3.2 > values.yaml
You can just explore them.
To customize installation you should prepare your own values file that will override default values. I’ve prepared my values file before.
alertmanager:
  ingress:
    enabled: true
    ingressClassName: ngnix
    hosts: [alertmanager.demo.com]

grafana:
  ingress:
    enabled: true
    ingressClassName: ngnix
    hosts: [grafana.demo.com]

prometheus:
  ingress:
    enabled: true
    ingressClassName: ngnix
    hosts: [prometheus.demo.com]

windowsMonitoring:
  enabled: false

defaultRules:
  rules:
    alertmanager: false
    etcd: false
    configReloaders: false
I enabled Ingress for Alert Manager, Grafana, and Prometheus. Also, I disabled windowsMonitoring. Lastly, I turned off some default rules.
After preparation of the custom values let’s install the chart. To do it I use the helm upgrade command with the install option. I also add a debug option to enable verbose output. In the values option set the values file with overridden variables. Don’t forget to set the right version.
helm upgrade --install \
             --namespace monitoring \
             --create-namespace \
             --atomic \
             --debug \
             --timeout 300s \
             --values my-values.yaml \
             prometheus-stack prometheus-community/kube-prometheus-stack --version 61.3.2
Wait while the installation is finished. Let’s check the pods in the monitoring namespace.
kubectl -n monitoring get pod
Explore web interfaces
After that check web interfaces are running. I need to add all my domains to the /etc/hosts file to open them.
You can find domains using the “kubectl get ingress” command. I am using the echo and tee commands for each domain.
kubectl -n monitoring get ingress

echo "192.168.1.251 grafana.demo.com" | sudo tee --append /etc/hosts
echo "192.168.1.251 alertmanager.demo.com" | sudo tee --append /etc/hosts
echo "192.168.1.251 prometheus.demo.com" | sudo tee --append /etc/hosts

grep 192.168.1.251 /etc/hosts
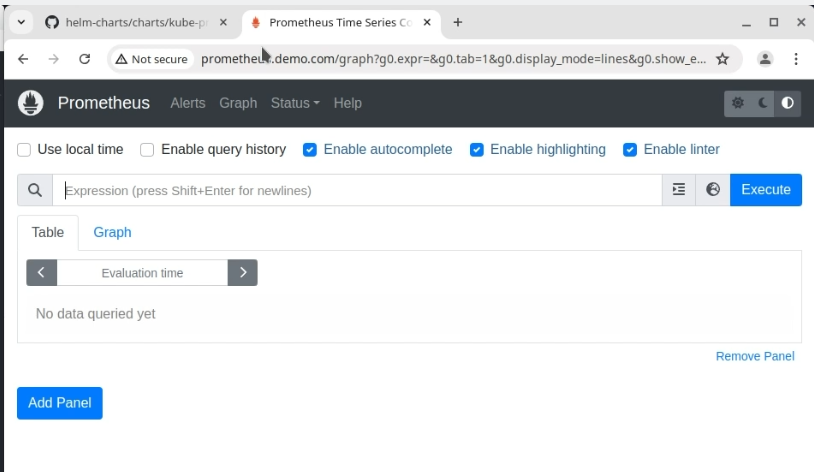
Go back to your browser. First, open the Prometheus web interface. It is running.

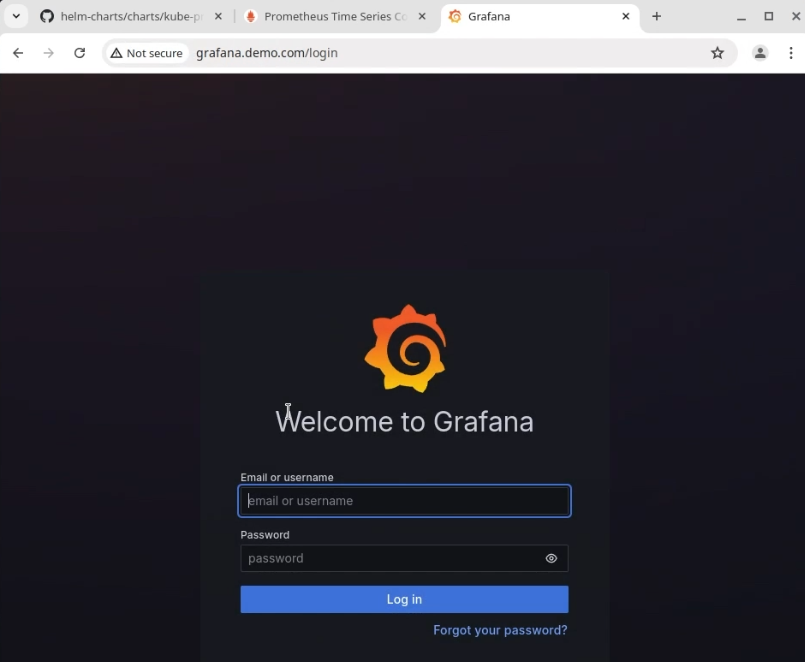
Second, open grafana.

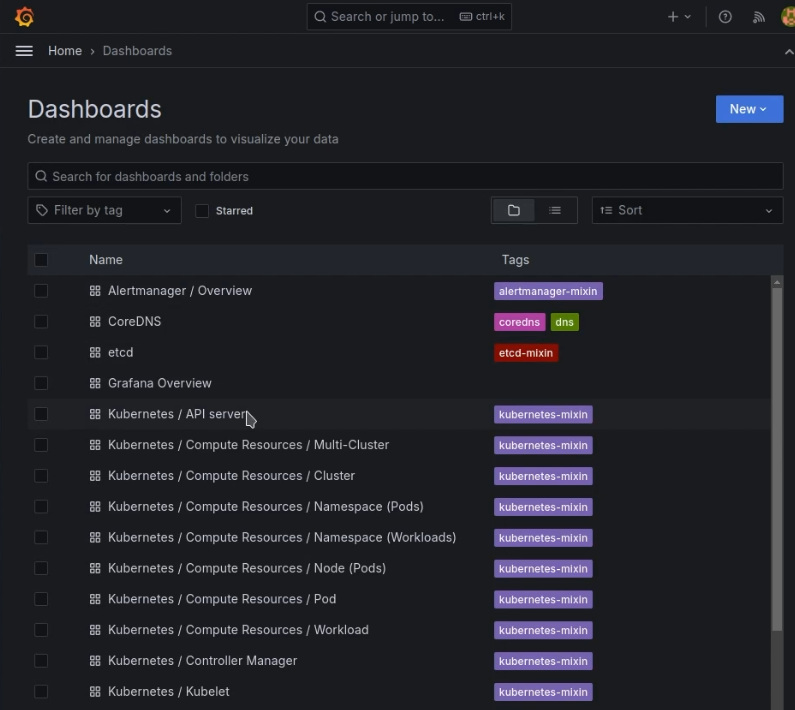
The default user is admin and the password is prom-operator. As you see below there are a lot of useful predefined dashboards in the kube prometheus stack.

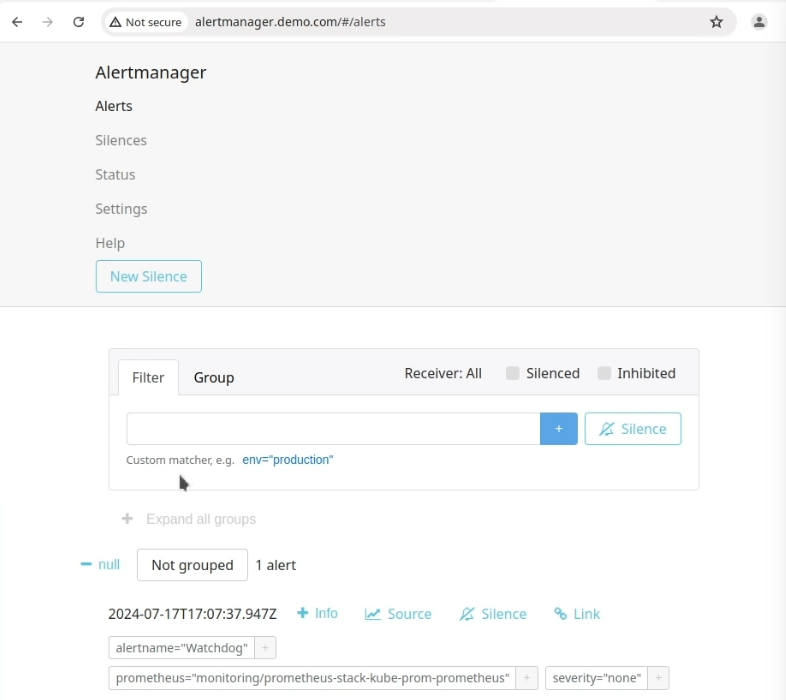
Lastly, open alert manager.

All applications are running. The next step is to explore default values deeper. For example, you can create credentials for Grafana admin in your secret.
That’s it. I hope this video was helpful to you. Don’t forget to hit the like button and subscribe to the channel. See you. Bye!